Viewing Trunk Utilization
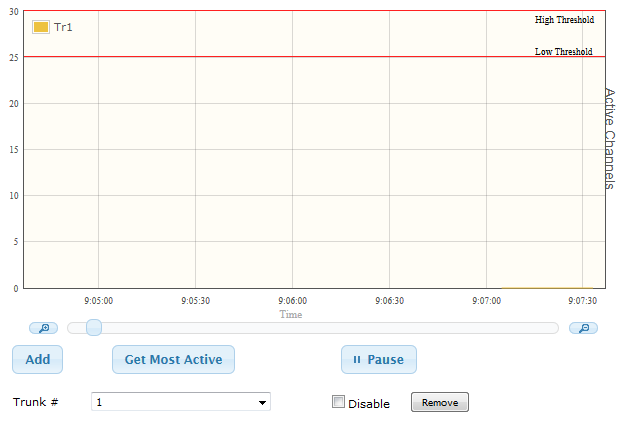
You can view the number of active channels per trunk over time in the Web interface's Trunk Utilization page. The page displays a graph, where the x-axis indicates the time (hh:mm:ss) and the y-axis the number of active trunk channels.
| ● | The Trunk Utilization page is applicable only to the Gateway application. |
| ● | To view the graph, your device must be connected to and configured with trunks. |
| ● | To view the graph, you must first disable the SBC application. |
| ● | If you navigate to a different page, the data displayed on the graph and all its settings are cleared. |
| ➢ | To view the number of active trunk channels: |
| 1. | Open the Trunk Utilization page (Monitor menu > Monitor tab > Performance Monitoring folder > Trunk Utilization). |
| 2. | From the 'Trunk' drop-down list, select the trunk for which you want to view active channels. |
| 3. | For more graph functionality, see the following table: |
Additional Graph Functionality for Trunk Utilization
|
Button |
Description |
|---|---|
|
Add button |
Displays additional trunks in the graph. Up to five trunks can be displayed simultaneously. To view another trunk, click the button and then from the new 'Trunk' drop-down list, select the required trunk. The graph displays each trunk in a different color, according to the legend shown in the top-left corner of the graph. |
|
Remove button |
Removes the corresponding trunk from the graph. |
|
Disable check box |
Hides or shows an already selected trunk. Select the check box to hide the trunk display; clear the check box to show the trunk. This is useful if you do not want to remove the trunk entirely (using the Remove button). |
|
Get Most Active button |
Displays only the trunk with the most active channels (i.e., trunk with the most calls). |
|
Pause button |
Pauses the display in the graph. |
|
Play button |
Resumes the display in the graph. |
|
Zoom slide ruler and buttons |
Increases or reduces the trunk utilization display resolution concerning time. The Zoom In |